In Microsoft Dynamics AX 2012, development can be done in both X++ and .NET managed code. The development environment you use is either the MorphX Integrated Development Environment (IDE) or the Visual Studio IDE depending on the type of development you are doing.
Because X++ and .NET development are integrated, debugging may require that you use the Microsoft Dynamics AX debugger and the Visual Studio debugger depending on your development scenario. This topic provides an overview of common debugging scenarios and information about which debugger to use.
These debugging scenarios include the following:
X++ Code
The process for debugging X++ code varies depending on whether you are debugging standard X++ code or X++ code that is executed in Common Intermediate Language (CIL).
 Standard X++ Code
To debug X++ code, you use the Microsoft Dynamics AX debugger. This is the full-featured debugger that is part of the MorphX suite of tools. You can use this debugger to debug X++ code that:
- Runs on the client
- Runs on the server and is not executed in CIL
To debug X++ code, you set a breakpoint in the MorphX code editor. When you run the code, execution stops at the breakpoint and the Microsoft Dynamics AX debugger opens. You can continue to step through the code in the debugger. For more information, see Microsoft Dynamics AX Debugger.
 X++ Code that Calls runAs
In X++, you can use the runAs function to call a static method and specify that it is executed in CIL. You can only use this command to run code that runs on the server. Because the method runs in CIL, you must use Visual Studio to debug it.
The high-level process for debugging code called from a runAs function by using the Visual Studio debugger is as follows:
- Open your X++ code in the MorphX code editor and set a breakpoint on the line of code that calls the runAsfunction.
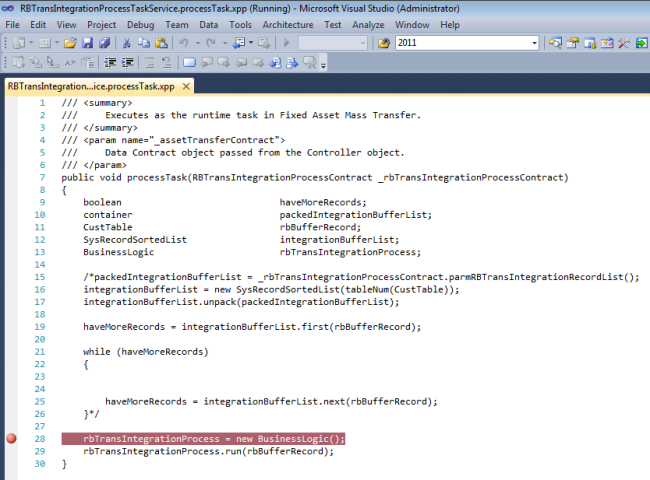
- Open Visual Studio. Use Application Explorer to open the X++ source code called by the runAs function and then set a breakpoint.
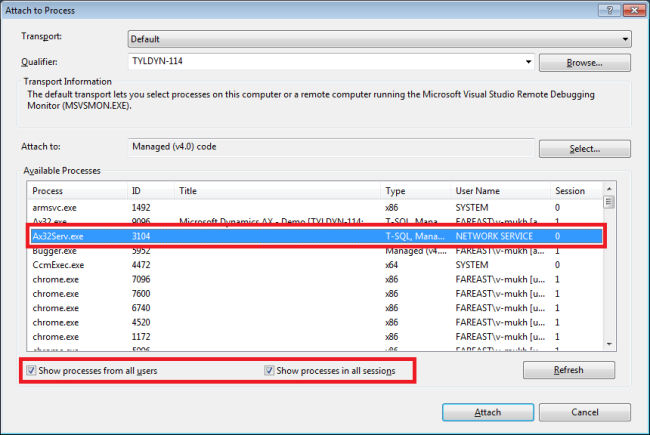
- In Visual Studio, attach the debugger to the server process (Ax32Serv.exe).
- Run the code in MorphX or step through the code in the Microsoft Dynamics AX debugger.
- When the breakpoint is reached in the source code that is running in CIL, context switches to Visual Studio and you can continue to step through the code.
 Tip Tip |
|---|
When you debug code that is called by the runAs function in Visual Studio, you cannot change the X++ source code in the Visual Studio IDE. You must make the changes in X++, and then do an incremental CIL build to regenerate the .xpp files.
|
 Create the .xpp Source Files
An .xpp file contains the X++ source code for one method of a class or table that is in the AOT. The Visual Studio debugger uses .xpp files when you debug X++ that has been compiled to CIL.
The generated .xpp files are stored in a directory path that might resemble:
C:\Microsoft Dynamics AX\60\Server\Microsoft\bin\XppIL\source\
C:\Microsoft Dynamics AX\60\Server\Microsoft\bin\XppIL\source\
You prompt the system to create all the .xpp files by following these steps:
- Start the Microsoft Dynamics AX Server Configuration Utility.
- On the Application Object Server tab, select the check box that is labeled Enable breakpoints to debug X++ code running on this server.
- Restart the Application Object Server (AOS). The XppIL\source\ directory is created and populated.
Thereafter, the .xpp files that correspond to new or modified X++ methods are refreshed on subsequent compiles to CIL.
Managed Code
When you use managed code to develop applications for Microsoft Dynamics AX, you can:
- Call managed code from X++
- Call X++ code from managed code
The debugging process varies depending on whether you start debugging from the MorphX IDE or from the Visual Studio IDE.
 Debugging from MorphX
A common development scenario is calling managed code from X++. In order to do this, you create a managed code assembly in Visual Studio and add the assembly to the model store by using Application Explorer. After you have added the assembly project to the model store, the assembly classes are available from X++ code.
To debug managed code that is called from X++, you use both the Microsoft Dynamics AX debugger and the Visual Studio debugger. The high-level process for debugging from the MorphX IDE is as follows:
- Open your managed code in Visual Studio and set the breakpoints.
- Attach the Visual Studio debugger to the Microsoft Dynamics AX server (Ax32Serve.exe) or client (Ax32.exe) process.
- In the MorphX code editor, set the breakpoints, run your code, and use the Microsoft Dynamics AX debugger as you would typically.
- When code execution switches to managed code, context switches to the Visual Studio debugger. When you are finished stepping through managed code, control returns to the Microsoft Dynamics AX debugger.
 Debugging from Visual Studio
Before you can call X++ code from managed code, you must first add the managed code project to the model store. After you have done this, you can then use Application Explorer to add elements from the Application Object Tree (AOT) to a Visual Studio project.
To debug X++ code that is called from managed code, you use both the Visual Studio debugger and the Microsoft Dynamics AX debugger. To simplify the debugging process, you can use the debug properties on the .NET project. After you set these properties, the Visual Studio debugger will automatically attach to the correct Microsoft Dynamics AX process (server or client), call the X++ code that you specify, and stop at the breakpoints that you have set.
The high-level process for debugging from Visual Studio is as follows:
- In the MorphX code editor, set the breakpoints in X++.
- Open your managed code in Visual Studio. Make sure that the debug properties are set correctly on the project.
- Press F5 to run the project.
- When code execution reaches a breakpoint in X++ code, context switches to the Microsoft Dynamics AX debugger. When you are finished stepping through X++ code, control returns to the Visual Studio debugger.
 Note Note |
|---|
Instead of setting the debug properties on the .NET project (which causes the Visual Studio debugger to automatically attach to the appropriate Microsoft Dynamics AX process), you can manually attach the debugger to the process.
|
For more information about how to debug managed code, see Walkthrough: Debugging a Managed Code Event Handler.
Services
A service in Microsoft Dynamics AX is an X++ class that you expose as a service by adding attributes to the class and its methods. Services that you create in Microsoft Dynamics AX are compiled into CIL and run on the server. Therefore, you must use the Visual Studio debugger to debug them.
While you are developing a service class in X++, you can use the Microsoft Dynamics AX debugger to debug the functionality. To debug the code that calls the service, you then use Visual Studio.
The high-level process for debugging a service from Visual Studio is as follows:
- In Visual Studio, open the project that calls the Microsoft Dynamics AX service.
- In Application Explorer, locate the service operation that you are calling and open the source code.
- Set a breakpoint in the service code.
- Attach the Visual Studio debugger to the Microsoft Dynamics AX server process (Ax32Serve.exe).
- Press F5 to run the project. When the debugger reaches a breakpoint in the service, it will stop and you can then step through the service code.
 TipWhen debugging a service in Visual Studio, you cannot change the source code in the Visual Studio IDE. You must make the changes in X++ and then deploy the integration port to regenerate the service .xpp files.
For more information about the Visual Studio debugger, see Debugging in Visual Studio.
Reports
SQL Server Reporting Services is the reporting platform for Microsoft Dynamics AX. The report development environment is integrated into Visual Studio. You can debug reports using the Microsoft Dynamics AX debugger or the Visual Studio debugger, or you can create a job to verify the data that should be generated for the report. For information on how to configure debugging reports, see How to: Configure the Debugger to Debug a Report Data Provider Class. The tool that you use depends on the reporting solution.
Use the Microsoft Dynamics AX debugger for the following scenarios:
- Debug a report data provider (RDP) class that is bound to a dataset of a report.
- Debug a custom controller class for a report that runs within code and print management instructions.
- Debug a custom UI builder class for parameter dialog solutions.
- Debug a contract class for dataset generation input controllers.
Use the Visual Studio debugger for the following scenarios:
- An RDP class that requires pre-processing uses services to call the logic. There are two types of pre-process RDP reports:
- Reports that require print management because it is assumed that the same report will print to various destinations. Process the business logic once and then print the report to each destination.
- Reports that require lots of processing time.For example, the Inventory Closing report.
- A contract class that implements the Validate interface or the Initialize interface because it is executed using a service call.
- Batch reports that require a pre-processed RDP class. When reports run in a batch, the reporting framework code is compiled to CIL.
 NoteIf a report in the batch executes an RDP class that does not require pre-processing, Reporting Services will execute the RDP class, and the RDP class can be debugged using the Microsoft Dynamics AX debugger.
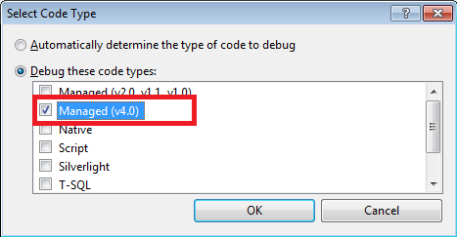
 - To debug C# data methods, attach the Visual Studio debugger to a Reporting Services process. Set the target to the .NET 2.0 code type.
Verify a report dataset by using an X++ job:
- Create a job to verify the report dataset for an RDP class based report. Pass a data contract to the job, call theprocessReport method, and then verify the results.
- Create a job to execute a query that is used in a report and then verify the data.
For more information about debugging and troubleshooting report issues, see Troubleshooting reporting.
Enterprise Portal
Both managed code and X++ code are used for Enterprise Portal. The C# managed code is used in User Controls that appear on Enterprise Portal pages. The X++ code is used in data sets, tables, and classes that are accessed by Enterprise Portal pages. You can use Visual Studio to debug the C# managed code. You can use the Microsoft Dynamics AX debugger to debug X++ code for Enterprise Portal.
 Managed code in Enterprise Portal
The high-level process for debugging managed code in Enterprise Portal is as follows:
- Configure the Enterprise Portal site to enable debugging.
- In Visual Studio, attach the Visual Studio debugger to the Enterprise Portal process.
- Add breakpoints to the User Control code that you want to debug.
- Display the page in Enterprise Portal that contains the managed code that you want to debug.
For more information about how to debug managed code in Enterprise Portal, see How to: Debug User Controls.
 X++ code in Enterprise Portal
The high-level process for debugging X++ code in Enterprise Portal is as follows:
- Configure the Microsoft Dynamics AX installation to enable debugging of X++ code in Enterprise Portal.
- In the Development Workspace, add breakpoints to the X++ code that you want to debug.
- Open the Microsoft Dynamics AX debugger.
- Display the page in Enterprise Portal that uses the X++ code that you want to debug.
For more information about how to debug X++ code in Enterprise Portal, see How to: Debug X++ Code on EP Pages.
Batch Jobs
Like services that you create in Microsoft Dynamics AX, batch jobs are compiled into CIL and run on the server. Therefore, you must use Visual Studio to debug batch jobs.
Batch jobs are used when you have code that you want to schedule to run at a specific time or in regular intervals. One example is if you have code that performs lots of processing that you want to run when the system is not heavily used. Code that runs as a batch job must be contained in a class that extends the RunBaseBatch class. For more information, see RunBase Framework.
The process for debugging a batch job is similar to debugging a service. When you create your class in X++, you can use the standard Microsoft Dynamics AX debugger. To debug a class that is running as a batch job, you then use the Visual Studio debugger.
The high-level process for debugging a batch job from Visual Studio is as follows:
- Open Visual Studio. In Application Explorer, locate the batch job class and open the source code.
- Set a breakpoint in the code.
- Attach the Visual Studio debugger to the Microsoft Dynamics AX server process (Ax32Serv.exe).
- In Microsoft Dynamics AX, schedule the batch job that calls your class to run.
- When code execution hits the breakpoint that you set, the context switches to Visual Studio and you can continue to step through the code.


